
The PagerDuty alert triggers. We all know how it starts.
We moved to micro-services to build faster, and in many ways, we succeeded. But that speed came with a trade-off: we made our systems significantly harder to operate. Where we could once diagnose a failure with a local stack trace, today’s incidents involve a complex web of distributed services.
This complexity creates an operational blind spot. It makes finding the origin of a failure difficult and slows down incident response.
One of the biggest challenges here is what we call transitive dependencies.
Defining the Problem
To understand why this is hard, we have to look at how services connect.
- A direct dependency is simple: Service A calls Service B.
- A transitive dependency is the chain: Service A calls Service B, which calls Service C, which queries Database D.
In this chain, Service A has a transitive dependency on Database D. If the database slows down, Service A might time out, even though they never talk to each other directly.
In real-world systems, this chain can be dozens of layers deep. A simple alert like "Service A has high latency" is just a symptom. The actual cause might be buried five hops downstream or, even harder to track, hidden in a data issue from weeks ago.
I was speaking with a client recently who described this frustration perfectly:
“We have data, but our main problem right now is tracking transitive dependencies... If we see a high error rate for a service, that service might depend on a few other services. Those services, in turn, depend on even more services... The metadata we have doesn't actually track this full dependency chain. We can only see the direct, single-level dependencies.”
This is the reality for most teams. Traditional monitoring and service maps often fail to show the full picture, which leads to longer Mean Time To Resolution (MTTR).
The Silent Data Failure
The most hidden dependencies often aren't the "online" call chains you can see in a trace. They are the implicit dependencies, particularly involving data.
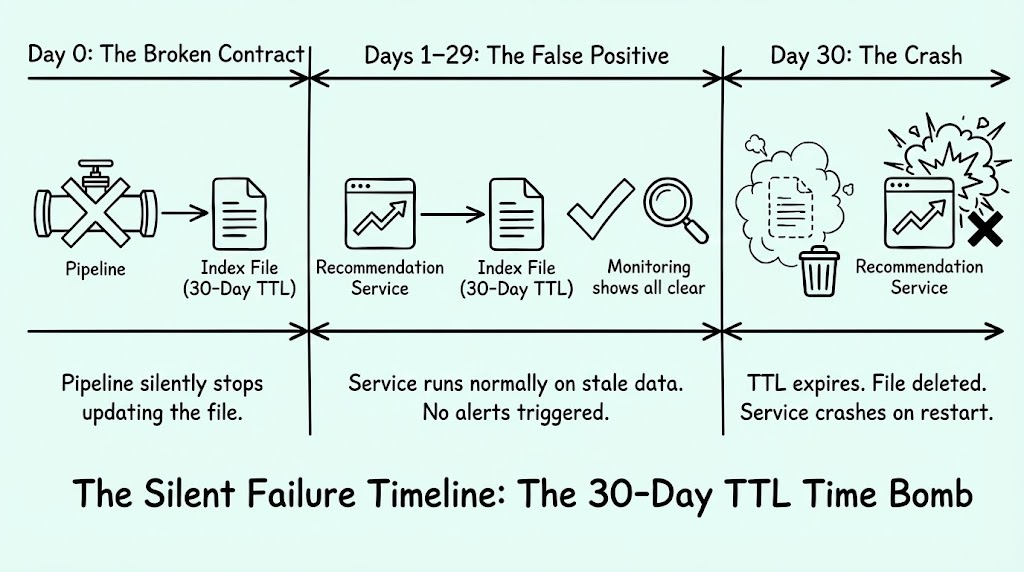
I remember a specific incident from my time at Snap that illustrates this perfectly.
We had a critical recommendation service that relied on data produced by an offline pipeline. The contract between these two systems wasn't an API call; it was a file transfer. The service required an index file to be loaded into memory on startup. If that file didn't exist, the service crashed.
Here is where the complexity deepened:
- The data file had a 30-day TTL (Time to Live).
- The pipeline generating the file began failing silently.
- For 29 days, the service operated normally because the old file was still there.
- On day 30, the file hit its TTL and was deleted.
Suddenly, the service crashed upon restart.
Standard monitoring tools offered no help because there was no trace to follow. The root cause was a silent failure from a month prior. Unless you knew the history—or remembered dealing with it before—it was almost impossible to figure out why it happened.
The Limits of Current Tools
When these failures happen, they often trigger an "Alert Storm." A single fault ripples upstream, causing cascading failures. The noise-to-signal ratio becomes so high that tools can’t identify the cause.
This forces organizations to rely on "tribal knowledge." We rely on the senior engineers who hold the system map in their heads.
The industry’s standard response to this is observability and distributed tracing. While these allow us to generate service maps, they have limits:
- Lack of Granularity: A service catalog might show that Service A depends on Service B, but it rarely shows which specific endpoint or code path is responsible.
- Blind spots: As seen in my experience at Snap, visualization tools are often blind to data dependencies separated by time.
Why RAG Isn't the Answer
To automate this, many are looking toward AI Site Reliability Engineers (SREs) powered by Retrieval-Augmented Generation (RAG).
While RAG is excellent for searching documentation, I believe it is insufficient for automated incident response. RAG results can be unstructured and variable. In an incident, you need deterministic answers, not approximations. RAG cannot reliably reconstruct a dependency graph or execute the precise validation steps needed to fix a production outage.
A More Sophisticated Approach: The Knowledge Graph
To fix the visibility crisis, we need to move from unstructured data to structured understanding. This is why we built the BACCA.AI Knowledge Graph.
We designed our Knowledge Graph to replicate the mental map of a senior engineer. Unlike RAG, which provides context, a Knowledge Graph provides a deterministic model of how your system fits together.
It addresses the problem in two ways:
- Granularity: It analyzes distributed traces to build a real-time graph of dependencies at the endpoint level, not just the service level.
- Implicit Dependencies: It learns from history. In the 30-day TTL scenario, the Knowledge Graph captures the connection between the service crash and the missing file because it records how human engineers investigated it previously.
Most importantly, it captures investigation steps. It learns which dashboards were viewed and which logs were queried to solve past problems. This allows the system to move from just showing you a map to automatically validating hypotheses.
Why Context is the Key
Transitive dependencies, whether they are deep call chains or invisible data links, are a fundamental obstacle to reliability.
Visibility without context is just noise. By combining an architectural map with the institutional knowledge of how systems fail, we can build a foundation for true automation.
This turns the AI SRE from a simple search tool into a partner that actually helps you diagnose the problem.
Eric Lu, Founder & CEO
we will contact you soon